By M. Ayhan Kose, Gitanjali Kumar & Peter Selcuk
The Middle East conflict delivered one of the biggest disruptions to global oil supplies in decades. The disruption of oil shipments through the Strait of Hormuz earlier this year briefly drove Brent crude prices to nearly $120 a barrel—roughly two-thirds higher than the price on the eve of the conflict. Yet the global economy has so far escaped the steep downturn that used to accompany similar oil shocks.
Consensus forecasts now put global growth at about 2.6 percent in 2026, close to what was expected in January and above the more pessimistic projections made in the spring. Yet the danger has not passed. The conflict has already added to inflationary pressures and pushed up borrowing costs, and a renewed rise in energy prices could further increase them.
The result is a striking paradox: The global economy has withstood a historic oil shock, but inflation and borrowing costs are rising. Five questions examine what has sustained this resilience—and why policymakers must remain vigilant.
1. How has the conflict affected energy and financial markets?
The effects have so far been severe but uneven.
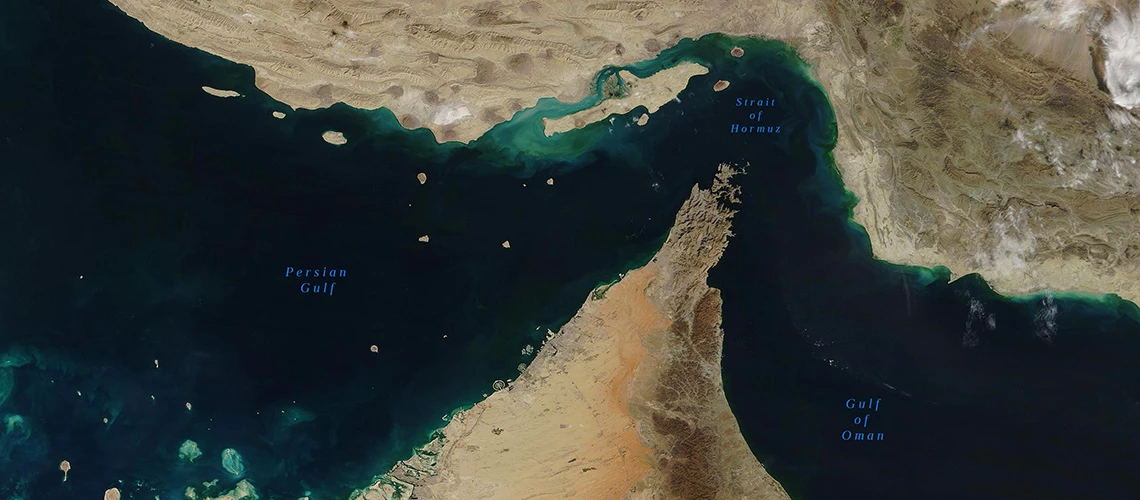
Oil prices surged after the conflict began, then retreated to near pre-conflict levels at the end of June as markets adjusted and fears of further disruption eased. More recently, prices have again approached the highs reached at the start of the conflict (Figure 1.A). The ongoing closures of the Strait of Hormuz have sharply reduced oil shipments and renewed pressure on energy and other commodity prices (Figure 1.B).
Financial markets have followed a different course. Investors initially retreated from risky assets, but equities rebounded strongly after the April ceasefire. Optimism about AI helped lift equity markets in advanced economies (Figure 1.C), and the gains spread to many emerging markets and developing economies (EMDEs). The recovery was not universal, however.

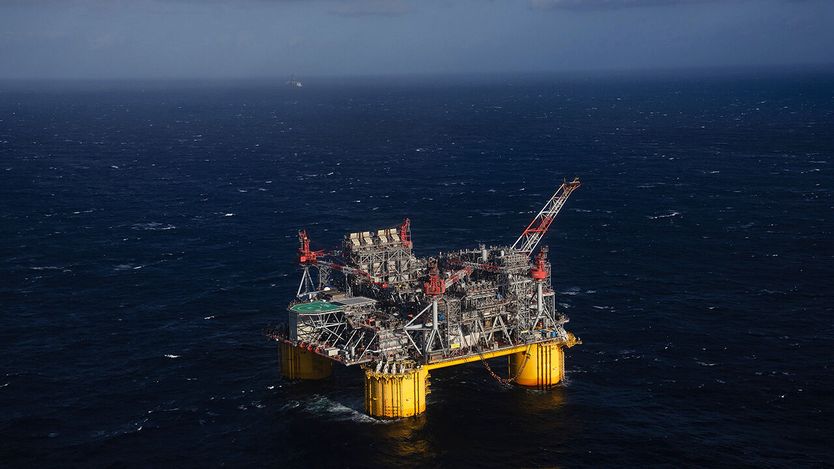
Why has the global economy so far withstood the shock caused by disruption of oil shipments through the Strait of Hormuz? | © Shutterstock.com
Financial market indicators in energy importers dependent on Middle Eastern supplies—and economies with pre-existing vulnerabilities—recovered more slowly. On the other hand, commodity exporters outside the conflict zone and countries with stronger policy frameworks and larger buffers saw their sovereign bond spreads rebound more rapidly (Figure 1.D). Nevertheless, following the renewed escalation of the conflict, long-term bond yields in advanced economies have risen substantially, pushing up borrowing costs in EMDEs.
Figure 1: Energy and financial market impacts

Sources: Bloomberg; Haver Analytics; J.P. Morgan; MSCI; World Bank.
Note: bbl = barrel; EMDEs = emerging market and developing economies.
A. Two-day moving average of Brent prices. Last observation is September 15, 2026.
B. Two-day moving average of vessels transiting the Strait of Hormuz, estimated from AIS ship-tracking data. GPS jamming, AIS spoofing, and vessels turning off transponders may distort recent data. Last observation is September 15, 2026.
C. Equity market indexes for the United States (S&P 500) and an aggregate of select emerging market economies (MSCI EM). Indexes are rebased to 100 on January 30, 2026. Last observation is September 11, 2026.
D. Lines show change in median EMBI spreads since February 27, 2026, using daily data, by economy group. The gray shaded area shows the 20th–80th percentile range. Sample includes up to 63 EMDEs. Vertical lines mark the dates of April 8 (ceasefire announced) and June 17 (Memorandum of Understanding signed). Commodity-exporting EMDEs directly affected by the conflict include Bahrain, Iraq, Saudi Arabia, and United Arab Emirates (included only through June 30th). Last observation is September 3, 2026.
2. How has the outlook for growth and inflation changed?
Since January, consensus forecasts for global growth in 2026 have fallen by only 0.1 percentage point (Figure 2.A), while inflation forecasts have risen by about 0.8 percentage point, to 3.4 percent (Figure 2.B). In EMDEs, projected inflation has increased from 3.3 percent to nearly 4.2 percent.
The growth picture is much less reassuring outside the largest EMDEs. Growth in EMDEs excluding China and India is forecast to slow from 3.0 percent in 2025 to 2.5 percent in 2026, about 0.4 percentage point below January expectations. The impact is especially severe in economies directly affected by the Middle East conflict. By contrast, growth forecasts in East Asia and Pacific and South Asia are in line with, or stronger than January expectations. Strength in these regions has helped somewhat offset severe losses in conflict-affected economies.
Higher energy prices feed quickly into fuel and electricity bills and raise costs for transportation, shelter, food production, and manufacturing. Their effect on economic activity can take longer to emerge as households adjust spending and firms reconsider investment. The small revision to global growth forecasts since January may therefore understate the risk to growth if high energy prices persist.
Renewed price pressures have complicated the task facing central banks. Some, including in major advanced economies, have raised policy rates, while others have become more cautious about easing. If inflation remains elevated, higher borrowing costs could restrain spending and investment.
Figure 2: Growth and inflation impacts

Sources: Consensus Economics; World Bank.
Note: EMDEs = emerging market and developing economies. GDP aggregates calculated using real U.S. dollar GDP weights at average 2010-19 prices and market exchange rates. Sample includes up to 86 economies, including 34 advanced economies and 52 EMDEs, for which Consensus Economics provides continuous survey data. Last observation is September 11, 2026.
A. GDP-weighted averages of annual GDP growth forecasts by economy group.
B. GDP-weighted averages of inflation forecasts by economy group.
3. What has kept the global economy from sliding into a deeper downturn?
Four factors have made the difference. First, energy markets adjusted rapidly. Inventories were drawn down, producers outside the conflict region increased exports, and weaker demand in several major economies helped limit the rise in oil prices.
Second, governments acted quickly.
Governments and businesses conserved energy, used strategic reserves, and switched to alternatives, including renewables and coal. Many developing economies introduced fuel subsidies, price caps, and other measures to shield households and businesses. These interventions provided immediate relief, though they also increased pressure on public finances. As the scale of the shock became evident, international financial institutions complemented these efforts. The World Bank Group made $50 billion to $60 billion available to help countries protect vulnerable households, strengthen public finances, and provide capital and liquidity to businesses. If conditions deteriorate further, it has room to scale up that support to $80 billion to $100 billion over 15 months.
Third, AI investment became a powerful engine of global demand. Large-scale capital spending in the United States has supported activity and trade. The benefits have extended to EMDEs, particularly in East Asian economies, through stronger demand for electronics and other inputs used in AI infrastructure, as reflected in the strength of global electronics manufacturing activity (Figure 3.A). New trade agreements and efforts to diversify supply chains have provided additional support.
Fourth, many EMDEs entered the crisis with stronger policy frameworks than they had during earlier shocks. More of these economies now use inflation targets and fiscal rules (Figure 3.B). Many have larger foreign currency reserves, deeper local capital markets, and more credible central banks. These strengths have helped some economies retain investor confidence.
Figure 3: AI-related activity and policy frameworks

Sources: Alonso et al. (2025); AREAER (database); Haver Analytics; IMF Fiscal Rules Dataset (database); World Bank.
Note: EAP = East Asia and Pacific; EMDEs = emerging market and developing economies; PMI = purchasing managers’ index.
A. Blue line shows a three-month moving average of global PMI for the manufacture of electronic equipment. Red line shows a three-month moving average of headline manufacturing PMI for five EAP EMDEs (China, Malaysia, Philippines, Thailand, and Viet Nam). PMI readings above (below) 50 indicate expansion (contraction). Last observation is August 2026.
B. Bars show period averages.
4. What dangers lie beneath the global economy’s resilience?
The latest shock hit economies already weakened by the pandemic, supply disruptions and the inflation surge, and geopolitical tensions. These successive blows have depleted fiscal buffers (Figure 4.A) and pushed debt higher in many EMDEs. Measures intended to protect households from the energy shock have added to the pressure. Rising global interest rates are now making that debt more expensive to refinance and service.
The result can be a vicious cycle. High debt and tighter financing conditions restrict public and private investment. Weak investment limits productivity and growth. Slow growth makes debt harder to manage. Governments are left with less room to respond when the next crisis arrives.
The long-term consequences of these successive shocks are already visible. By 2028, EMDEs excluding China and India are on track to have lost nearly a decade of income convergence with advanced economies. Many fragile and conflict-affected countries are falling farther behind. Further increases in food prices, potentially compounded by a historically strong El Niño, could deepen food insecurity in countries that are home to many of the world’s poorest people.
These vulnerabilities are mounting just as EMDEs confront a jobs challenge of historic proportions. Over the next decade, an estimated 1.2 billion young people will reach working age (Figure 4.B). More than one-fifth of them live in economies affected by fragility and conflict. Creating jobs for this generation is both a formidable challenge and a major opportunity for growth.
Figure 4: Debt vulnerabilities and the jobs challenge

Sources: Kose et al. (2021, 2022); UN World Population Prospects (2024); World Bank. Note: EAP = East Asia and Pacific; ECA = Europe and Central Asia; EMDEs = emerging market and developing economies; GDP = gross domestic product; LAC = Latin America and the Caribbean; MNA = Middle East, North Africa, Afghanistan, and Pakistan; RHS = right-hand scale; SAR = South Asia; SSA = Sub-Saharan Africa.
A. Aggregates computed as weighted averages using GDP in U.S. dollars as weights, based on data for up to 151 EMDEs for government debt and up to 153 EMDEs for fiscal balances.
B. Bars show the number of young people aged 15–24 living in each region in 2035.
5. What should policymakers do now?
Three priorities are critical. First, protect the most vulnerable. Higher food and energy prices erode purchasing power, especially for poorer households, which spend more of their income on these essentials. Governments should provide targeted, temporary support to vulnerable households and businesses without placing significant further strain on public finances.
Second, make careful fiscal and monetary policy choices. Policymakers must prevent the energy price shock from turning into persistent inflation. Governments must manage debt vulnerabilities while rebuilding fiscal buffers. Higher borrowing costs make this harder, particularly for heavily indebted governments that must devote more resources to debt service. Credible medium-term fiscal policies and strong institutions will help economies withstand future shocks.
Third, strengthen growth and create jobs. That requires more investment, higher productivity growth, and greater opportunities in sectors capable of employing large numbers of workers. The priorities are to deliver foundational infrastructure, foster an environment in which businesses can grow, and mobilize private capital. Together, these efforts can turn demographic pressure into a source of job creation and growth.
The global economy has taken repeated blows since 2020, and yet it has shown a notable capacity to withstand shocks. But, as the familiar warning to investors goes, past performance does not guarantee future results. Policy makers must use this period of resilience to rebuild economic strength—before the next shock arrives.
Source: World Bank